Average Retirement Income by Zip Code
Author: Datahood Team
Published: 2025-01-22
In this article, we delve into the intricacies of Average Retirement Income by Zip Code, a topic that not only sheds light on the financial landscape of retirees across the United States but also highlights the economic disparities that exist between different regions. By examining this data, we can gain valuable insights into the retirement trends that are shaping communities, understand the financial health of various regions, and identify areas where policy interventions may be necessary to address income inequality.
This analysis is particularly useful for policymakers, businesses, and researchers. Policymakers can use this information to craft targeted strategies aimed at reducing income disparities and improving the quality of life for retirees. Businesses can identify key demographics for retirement-related services, tailoring their offerings to meet the needs of specific communities. Researchers can explore the economic well-being of retirees, contributing to a broader understanding of how retirement income impacts overall financial stability.
The data for this analysis is sourced from the American Community Survey (ACS) provided by Census.gov, specifically focusing on the dataset titled “B19059: Retirement Income in the Past 12 Months for Households.” Released by the Census Bureau in late 2024, this dataset offers a comprehensive view of retirement income across different zip codes, allowing for a detailed examination of regional financial trends.
Understanding the average retirement income by zip code is fascinating because it reveals economic disparities, highlights retirement trends, and provides insight into regional financial health. This data is useful for various purposes, such as informing policymakers about income inequality, guiding businesses in identifying target demographics for retirement-related services, and helping researchers study the economic well-being of retirees across different regions.
The average retirement income in US is $31,481 in 2023.
According to the U.S. Census Bureau’s American Community Survey (ACS), retirement income consists of income from various sources related to retirement, but it does not necessarily represent the entire income of retired individuals. Here’s what it includes and what it doesn’t:
What Retirement Income Includes:
-
Pensions and Retirement Plans:
-
Employer-sponsored pensions (private and public).
-
401(k), 403(b), and similar retirement savings plans.
-
-
Annuities:
- Payments from annuities purchased as part of a retirement plan.
-
IRAs and Keogh Plans:
- Withdrawals from Individual Retirement Accounts (IRAs) and Keogh plans.
-
Other Retirement Systems:
- Federal, state, and local government retirement systems.
-
Military Retirement Pay:
- Retirement benefits specifically for military service members.
What Retirement Income Excludes:
-
Social Security Income:
- ACS collects Social Security income separately and does not include it in the “retirement income” category.
-
Earnings from Employment:
- Wages, salaries, or income from active work.
-
Investment Income:
- Dividends, interest, or rental income are categorized separately.
-
Other Non-Retirement Sources:
- Alimony, child support, or any other forms of assistance not directly linked to retirement plans.
Are They the Entire Income of Retired People?
No, retirement income is not the entire income of retired individuals. A retired person’s total income may also include:
-
Social Security benefits (a significant portion for many retirees).
-
Investment or rental income.
-
Part-time work earnings.
-
Other government assistance programs.
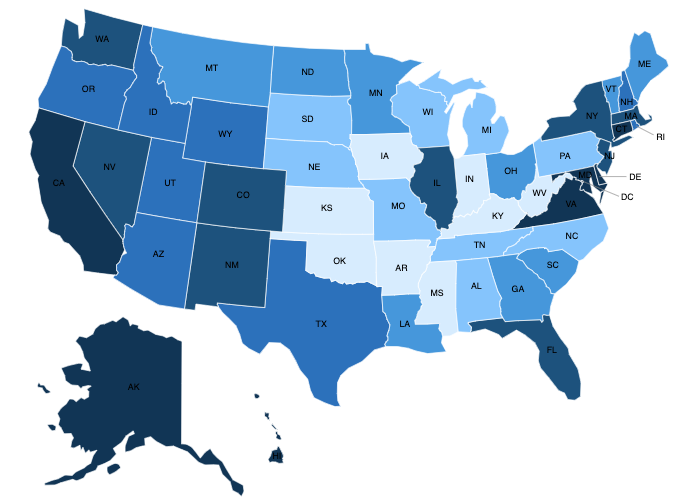
Average Retirement Income by State
In this US map, we can see the average retirement income by state. The state with the highest average retirement income is District of Columbia, with an average of $45,031.52 per household. The state with the lowest average retirement income is Indiana, with an average of $23,236.65 per household. We can also see from the color on the map. The darker the color, the higher the average retirement income. We can see the color are darker on the west coast and the east coast, while the color are lighter on the midwest, with the exception of Illinois. The states around Illinois formed a donut circle in the middle of the map. These states all have light color. It means the average retirement income of these states are lower than the national average. Indiana is the state with the lowest average retirement income, and the two other states under the “rust belt”, Kentucky and West Virginia, also have the lowest average retirement income.
| Rank | NAME | Retirement Income | Rank | NAME | Retirement Income | |
|---|---|---|---|---|---|---|
| 1 | District of Columbia | $45,031.52 | 27 | Minnesota | $29,530.82 | |
| 2 | Maryland | $39,926.64 | 28 | Montana | $29,428.90 | |
| 3 | California | $37,951.94 | 29 | South Carolina | $29,050.24 | |
| 4 | Hawaii | $37,654.37 | 30 | Georgia | $29,034.61 | |
| 5 | Virginia | $37,139.03 | 31 | Ohio | $28,722.49 | |
| 6 | Delaware | $37,027.83 | 32 | North Dakota | $28,676.82 | |
| 7 | Alaska | $36,659.74 | 33 | Maine | $28,635.90 | |
| 8 | Connecticut | $35,154.81 | 34 | Vermont | $28,478.14 | |
| 9 | Nevada | $34,775.23 | 35 | Wisconsin | $28,255.32 | |
| 10 | Massachusetts | $34,486.63 | 36 | North Carolina | $28,207.22 | |
| 11 | Colorado | $34,219.03 | 37 | Alabama | $28,023.61 | |
| 12 | Florida | $33,955.24 | 38 | Missouri | $27,898.27 | |
| 13 | New York | $33,834.40 | 39 | Nebraska | $27,814.24 | |
| 14 | New Jersey | $33,728.35 | 40 | Pennsylvania | $27,442.26 | |
| 15 | New Mexico | $33,721.44 | 41 | Tennessee | $27,418.46 | |
| 16 | Illinois | $33,337.42 | 42 | South Dakota | $27,032.57 | |
| 17 | Washington | $33,148.52 | 43 | Michigan | $27,004.27 | |
| 18 | Oregon | $32,376.47 | 44 | Oklahoma | $26,686.04 | |
| 19 | Rhode Island | $32,074.53 | 45 | Mississippi | $26,558.38 | |
| 20 | Utah | $31,936.54 | 46 | Kentucky | $26,151.44 | |
| 21 | Arizona | $31,624.78 | 47 | Kansas | $26,065.72 | |
| 22 | Idaho | $31,085.20 | 48 | Arkansas | $25,512.05 | |
| 23 | New Hampshire | $30,974.36 | 49 | Iowa | $25,416.60 | |
| 24 | Wyoming | $30,793.05 | 50 | West Virginia | $24,126.80 | |
| 25 | Texas | $30,649.85 | 51 | Indiana | $23,236.65 | |
| 26 | Louisiana | $29,713.89 | 52 | Puerto Rico | $18,952.51 |
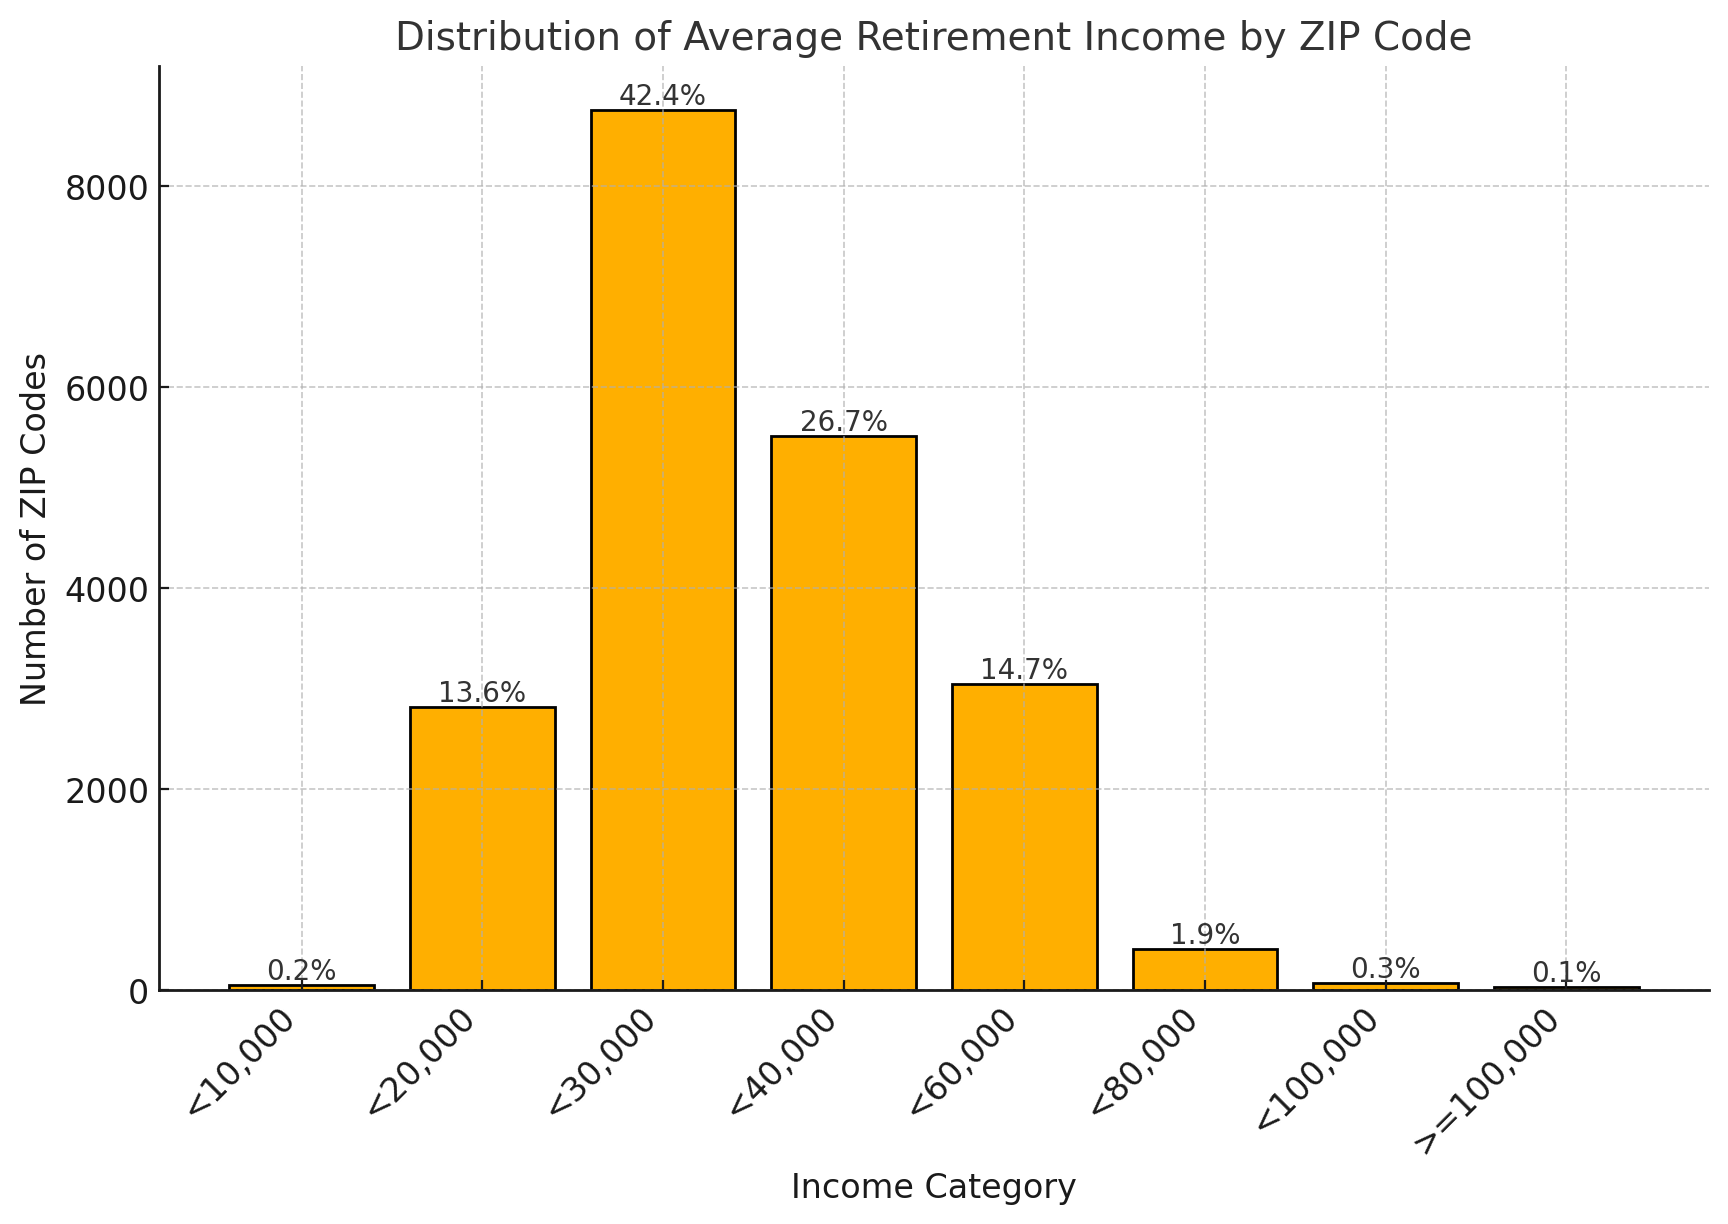
Average Retirement Income Distribution by Zip Code
WE can show the distribution of average retirement income by zip code. The most common income range is between $20,000 and $30,000, which accounts for 42.4% of all zip codes. And 97.7% of the zip codes have an average retirement income less than $60,000. To have a meamningful average, we only keep the zip code with more than 150 households. The median retirement income among all the zip codesis approximately $28,449.69.
Top 20 Zip Codes with highest average retirement income
| Zip Code | Primary City | State | Avg Retirement Income Per Household |
|---|---|---|---|
| 28207 | Charlotte | NC | $224,982 |
| 10018 | New York | NY | $166,410 |
| 11005 | Floral Park | NY | $161,879 |
| 24325 | Dugspur | VA | $153,762 |
| 33125 | Miami | FL | $149,898 |
| 39663 | Silver Creek | MS | $142,824 |
| 22027 | Dunn Loring | VA | $139,928 |
| 92342 | Helendale | CA | $134,683 |
| 78058 | Mountain Home | TX | $126,271 |
| 11935 | Cutchogue | NY | $122,176 |
| 90077 | Los Angeles | CA | $121,792 |
| 60601 | Chicago | IL | $117,286 |
| 60558 | Western Springs | IL | $114,256 |
| 04743 | Fort Kent | ME | $110,809 |
| 24313 | Barren Springs | VA | $109,637 |
| 94027 | Atherton | CA | $108,602 |
| 33066 | Pompano Beach | FL | $108,202 |
| 92617 | Irvine | CA | $108,162 |
| 93432 | Creston | CA | $101,394 |
| 83420 | Ashton | ID | $101,099 |
DOWNLOAD THE DATA FILE WITH ALL ZIP CODES AND THEIR AVERAGE RETIREMENT INCOME: Average Retirement Income by Zip Code
Average Retirement Income by City and by County
Top 20 Cities with highest average retirement income
The table presents a list of the top 20 cities in the United States with the highest average retirement income per household. Cherry Hills Village in Colorado leads the list with an impressive average retirement income of $165,283.00. This is followed by Fort Kent in Maine and Silver Lakes in California, with average incomes of $141,895.57 and $135,972.82, respectively. The data highlights significant regional variations, with cities from diverse states such as Alabama, New York, and Florida making the list. Notably, California has multiple entries, indicating a trend of higher retirement incomes in certain areas of the state. This table provides valuable insights into the economic well-being of retirees in these cities, reflecting both the affluence and the cost of living in these regions.
| NAME | Avg Retirement Income Per Household |
|---|---|
| Cherry Hills Village city, Colorado | $165,283.00 |
| Fort Kent CDP, Maine | $141,895.57 |
| Silver Lakes CDP, California | $135,972.82 |
| Point Clear CDP, Alabama | $133,168.35 |
| Cutchogue CDP, New York | $122,175.51 |
| Fox Chapel borough, Pennsylvania | $120,348.14 |
| Pelican Bay CDP, Florida | $119,735.00 |
| Los Fresnos city, Texas | $118,295.82 |
| Forest Hills city, Tennessee | $116,463.56 |
| Bronxville village, New York | $116,425.56 |
| Western Springs village, Illinois | $114,255.97 |
| Canterwood CDP, Washington | $110,505.91 |
| Atherton town, California | $110,155.56 |
| Spring Grove village, Illinois | $108,796.13 |
| Freemansburg borough, Pennsylvania | $108,760.09 |
| Chevy Chase town, Maryland | $105,306.61 |
| Montecito CDP, California | $103,985.10 |
| Olympia Heights CDP, Florida | $103,773.18 |
| Palos Verdes Estates city, California | $103,666.50 |
| Westhampton Beach village, New York | $102,240.65 |
DOWNLOAD THE DATA FILE WITH ALL CITIES AND THEIR AVERAGE RETIREMENT INCOME: Average Retirement Income by City
Top 20 Counties with highest average retirement income
The table showcases the top 20 counties in the United States with the highest average retirement income per household. Leading the list is Los Alamos County in New Mexico, with an average retirement income of $75,360.63. This is followed by Falls Church city in Virginia and Tyler County in Texas, with average incomes of $62,662.43 and $61,359.58, respectively. The data reveals notable regional differences, with counties from various states such as Florida, Virginia, and California appearing prominently. Virginia, in particular, has several entries, suggesting a concentration of higher retirement incomes in certain areas. This table offers valuable insights into the financial status of retirees across these counties, reflecting both the economic prosperity and the cost of living in these regions.
| NAME | Avg Retirement Income Per Household |
|---|---|
| Los Alamos County, New Mexico | $75,360.63 |
| Falls Church city, Virginia | $62,662.43 |
| Tyler County, Texas | $61,359.58 |
| Collier County, Florida | $59,121.59 |
| Fairfax County, Virginia | $58,880.50 |
| Mono County, California | $58,814.21 |
| Arlington County, Virginia | $58,340.59 |
| Alexandria city, Virginia | $56,180.22 |
| Williamsburg city, Virginia | $55,937.85 |
| Archuleta County, Colorado | $55,602.70 |
| Lawrence County, Mississippi | $55,419.01 |
| Musselshell County, Montana | $54,835.93 |
| Juneau City and Borough, Alaska | $54,375.14 |
| Montgomery County, Maryland | $54,161.94 |
| Marin County, California | $52,772.83 |
| Fairbanks North Star Borough, Alaska | $52,434.08 |
| Summit County, Utah | $51,844.71 |
| James City County, Virginia | $51,686.35 |
| Lander County, Nevada | $51,411.60 |
| Early County, Georgia | $51,356.49 |
DOWNLOAD THE DATA FILE WITH ALL COUNTIES AND THEIR AVERAGE RETIREMENT INCOME: Average Retirement Income by County
This article provides a detailed overview of the regions in the United States with the highest average retirement incomes. It includes two comprehensive tables: one listing the top 20 cities and another listing the top 20 counties. The data highlights significant regional differences, with notable concentrations of high retirement incomes in states like Virginia, California, and Florida. The information presented offers valuable insights into the financial well-being of retirees in these areas, reflecting both economic prosperity and the cost of living. The article serves as a useful resource for understanding the distribution of retirement income across different parts of the country.